FidTech has partnered with GoodData to create our new Analytics function. Using this new functionality, Users will be able to explore data and create interactive Dashboards, charts and visuals using your data extracted from FoundationHub via a user-friendly, no-code UI.
Analytics allows you to drag and drop facts, metrics, and attributes to interactive zones to:
- Create Insights such as charts, graphs, and tables.
- Slice data
- Filter data
- Manipulate the way data is visualized
This guide will explain the basic functionality of analytics, including how to create Dashboards, Insights, and tailor your own Key Performance Indicators (KPIs) to enable you to more easily track your overall long term achievements. You will also learn how easy Analytics makes it easy to share and monitor changes in data.
Your Workspace
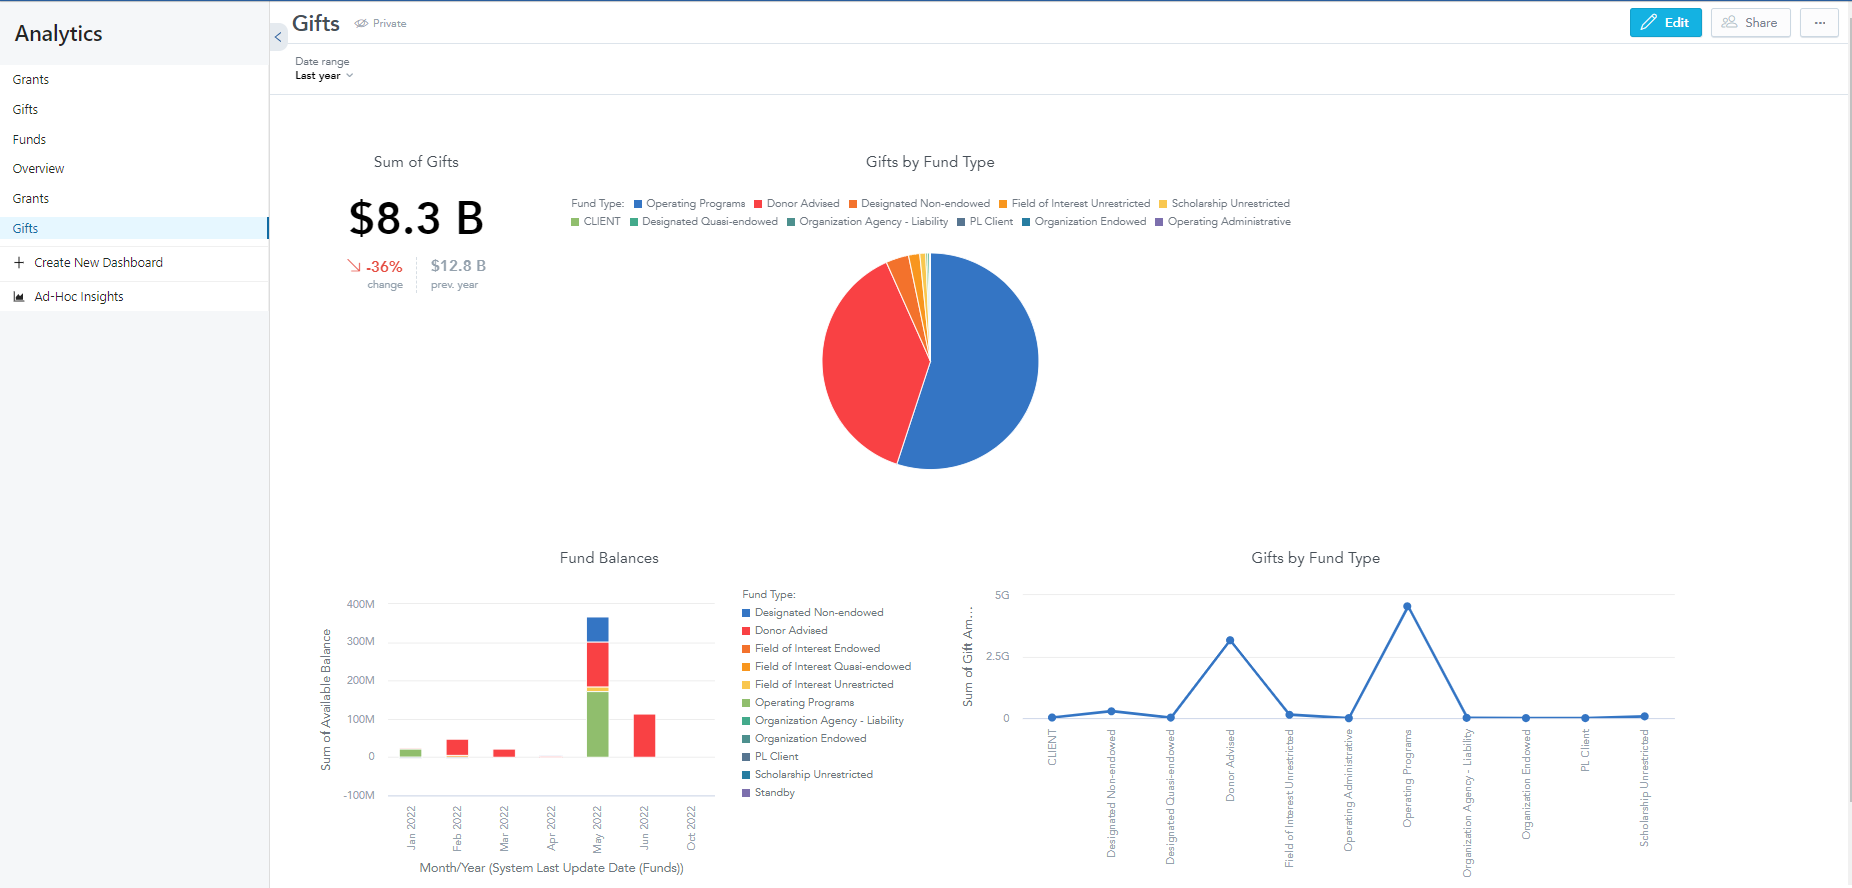
Welcome to your new Workspace – everything you as a User has access to that will allow you to create:
- Insights – Individual visuals (chart, column, etc.)
- Key Performance Indicators (KPIs) – Individual metric displays
- Dashboards – Made up of Insights
To open the GoodData platform from FoundationHub, select the tab named “Analytics”, in between the tabs for “Inbox” and “Support” on the right side of the upper toolbar.