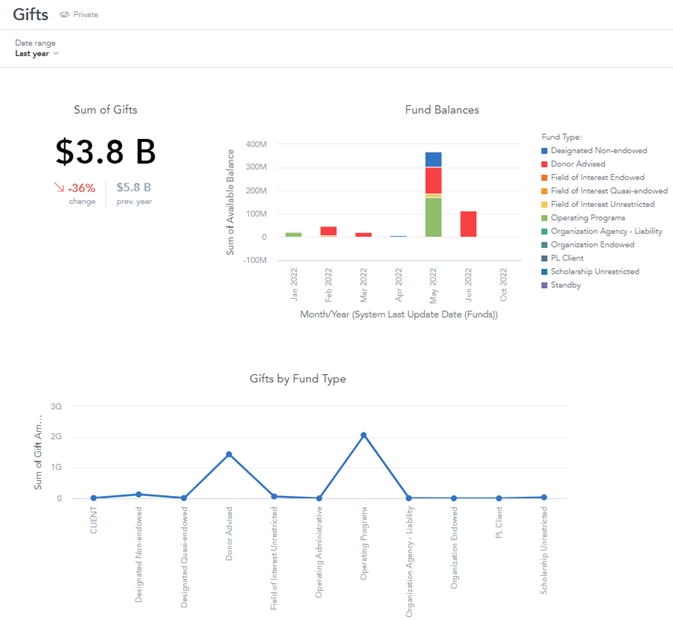
A Dashboard will allow the User to create and store related Insights to be presented or shared as one. This FTP-created Dashboard demonstrates how you can share data using two different Insights and a KPI:
Creating Dashboards
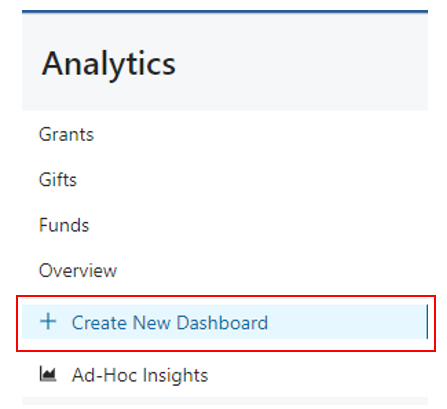
To create a Dashboard, click on the + Create New Dashboard and name your new Dashboard.
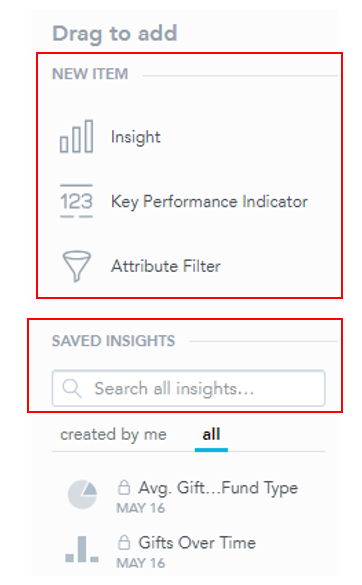
- Once you have created the Dashboard, you can either create a new Insight or KPI, using the options under “new item”, or drag and drop one of your saved Insights.
Note that you do not have to create a Dashboard to use the Ad-Hoc Insights function, but you will need to create a Dashboard to display or share any Insights you have previously created.
Dashboards have a flexible layout where you can add multiple Insights and KPIs in a single row. To edit the layout and the individual widgets (Insights or KPIs), click Edit in the top right corner.
- To rearrange [widgets] on a Dashboard, drag and drop them to a new place. The Dashboard displays the target place as you drag the [widget].
- If the size of headlines and KPIs is too small to display nicely, additional information can be displayed by clicking on the arrows at the bottom.