There are two Budget Reports available in FoundationHub.
Budget Report Period Over Period
Budget Report Period To Date
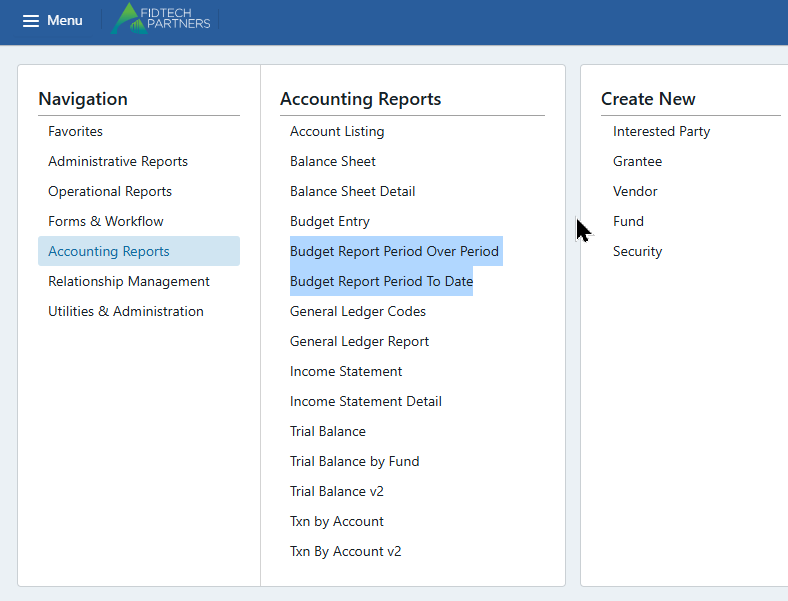
Navigate to: Menu > Accounting Reports
Period Over Period Budget Report
The Period Over Period Budget Report compares budgeted amounts to actuals across selected months or quarters and highlights how each period changes relative to a comparison period.
It displays both period level and year to date variances, that can help to monitor trends and identify spikes or dips in spending.
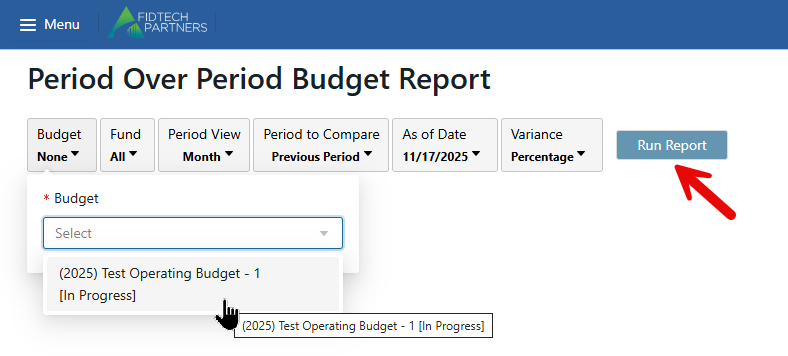
Select an existing Budget and click on Run Report. To learn how to create a Budget go to this link.
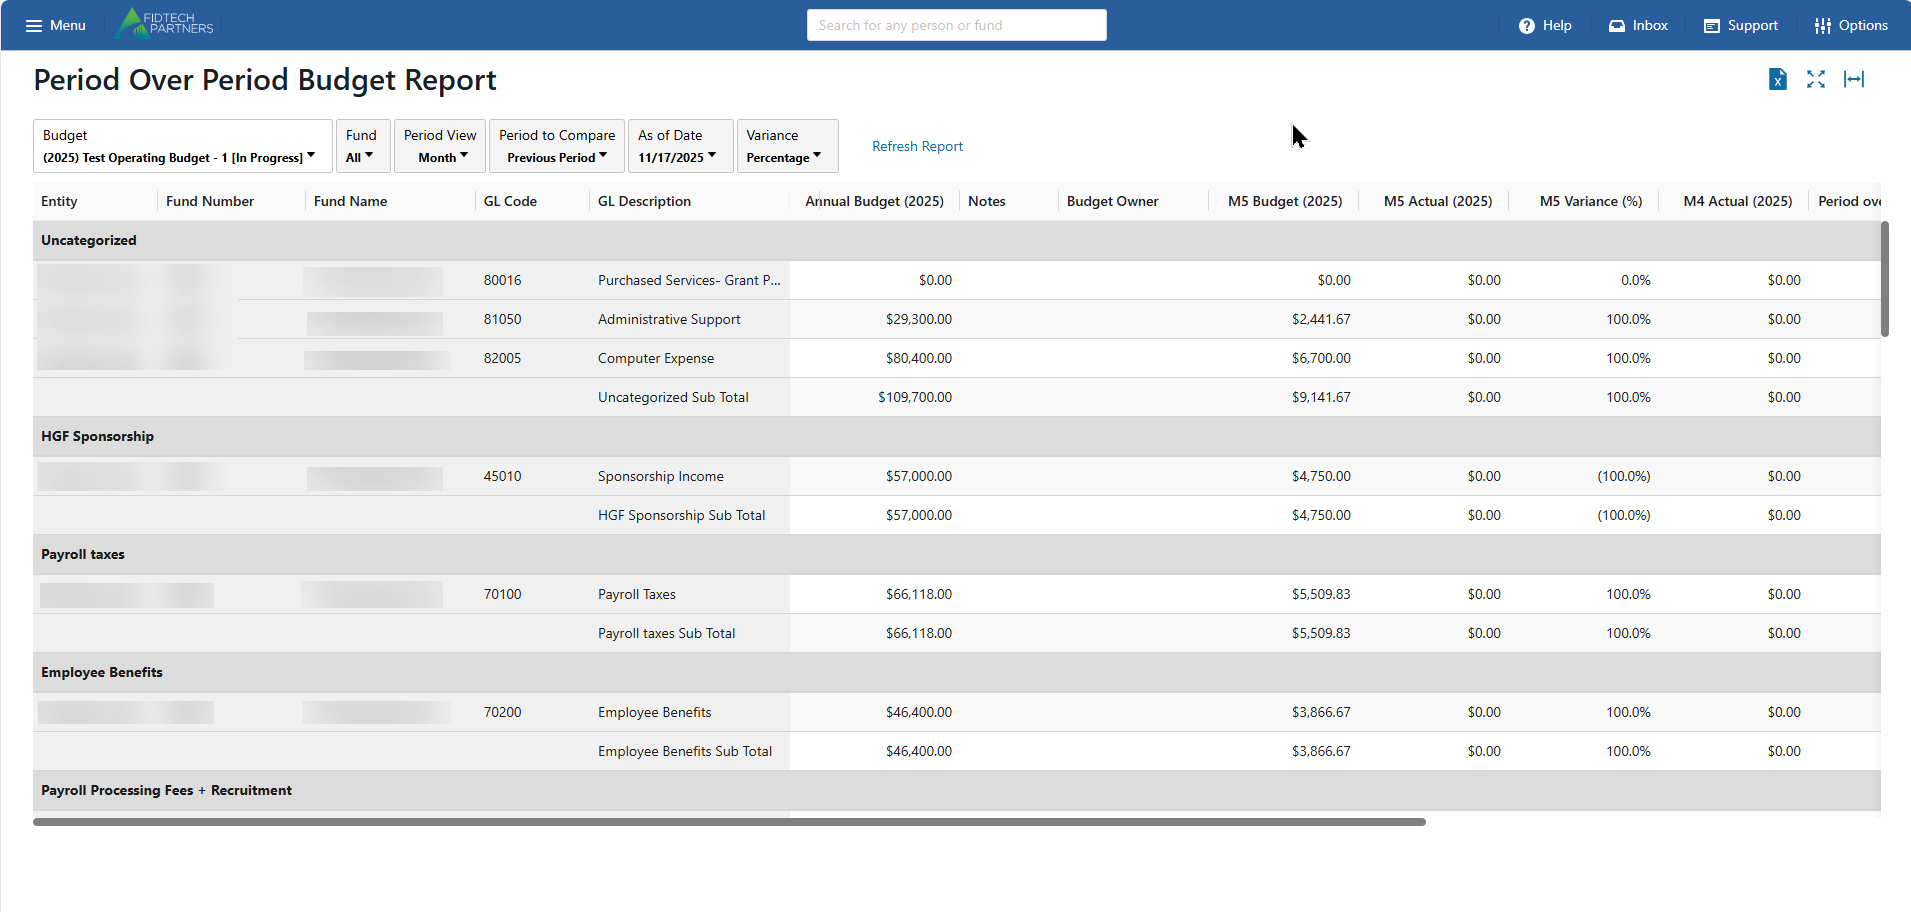
The report includes several filters that allow users to customize how budget versus actual data is displayed. Each filter controls a specific aspect of the report output.
Fund
This filter allows you to select which fund or group of funds to include in the report.
Choose a single fund to view a detailed comparison for that specific account.
Choose multiple funds to see consolidated totals across selected accounts.
Period View
Controls how the report displays time-based data. Options:
Month: Shows budget and actual figures for a specific month, along with month over month variances.
Quarter: Shows totals for a selected quarter and compares those totals against actuals for the same period.
Use this filter to change the level of detail shown for each reporting period.
Period to Compare
Defines the comparison baseline used in the variance calculations for the selected period. Options:
Previous Period:
If Period View is Month, compares the selected month to the prior month.
If Period View is Quarter, compares the selected quarter to the prior quarter.
Same Period from Previous Year:
Compares the selected period to the same month or quarter in the prior year (for example, May 2025 compared to May 2024).
This filter affects the Period over Period Variance (%) column in the report.
As of Date
Sets the date through which actuals should be included.
Actuals posted on or before this date will be reflected in the report.
Changing this date allows users to view budget versus actuals at different checkpoints within the year.
This filter impacts both the month or quarter selected and the YTD actual totals.
Variance
Controls how differences between budget and actuals are displayed. Options:
Percentage: Shows variances only as percentages.
Dollars: Shows variances only as dollar amounts.
Percentage/Dollars Both: Displays both dollar and percentage variances for each period and for YTD.
This filter applies to columns such as M5 Variance, Period over Period Variance, and YTD Variance.
Period To Date Budget Report
The Period To Date Budget Report compares budgeted amounts to actual spending for each GL Code.
It tracks performance by month, quarter, or year and highlights variances to show whether spending is over or under budget.
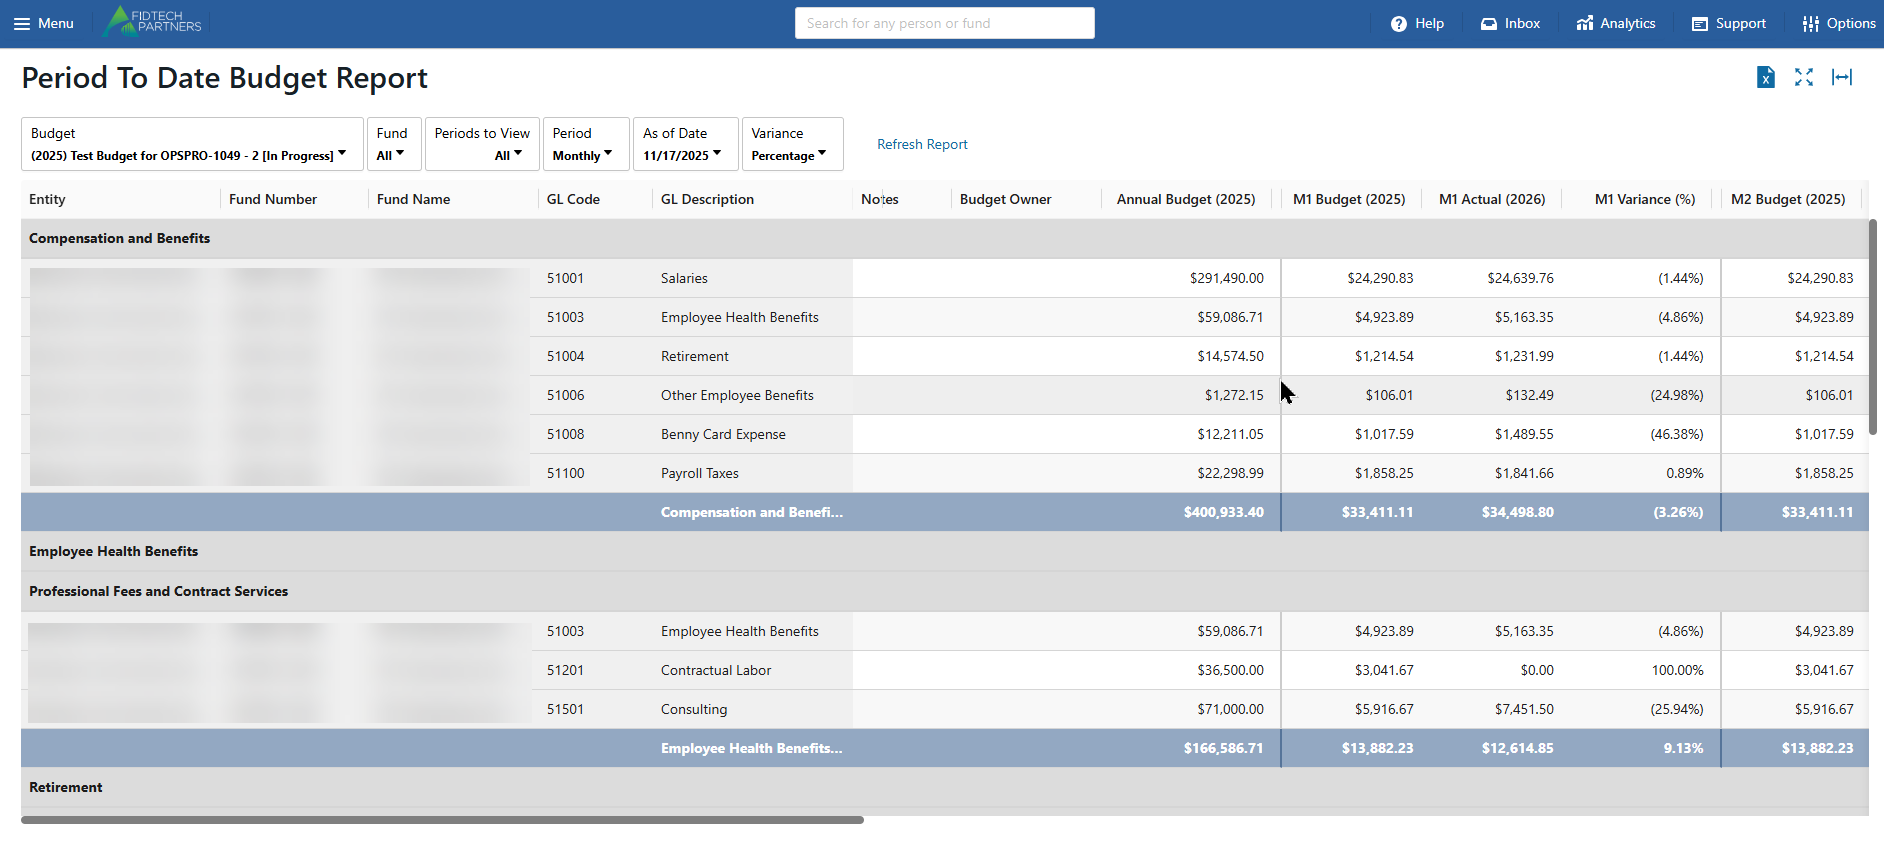
The report includes several filters that allow users to customize how budget versus actual data is displayed. Each filter controls a specific aspect of the report output.
Fund
Select which fund or group of funds to include.
Choosing a single fund shows detailed budget vs actuals for that fund.
Selecting multiple funds gives a consolidated view across all chosen funds.
Period to View: All, Single Report
All shows each period in sequence (for example, all months or all quarters).
Single Report provides a summarized view for one selected period only.
Period: Monthly, Quarterly, Yearly
Controls how the budget data is grouped.
Monthly shows budget vs actuals for each month such as M1, M2, M3.
Quarterly rolls up the activity into Q1, Q2, etc.
Yearly summarizes budgeted and actual totals for the entire year to date.
As of Date
Defines the end date for the reporting period.
The report only includes actuals up to this date.
Useful for mid month or mid quarter snapshots.
Variance: Percentage, Dollars, Percentage/Dollars (Both)
Controls how variances are displayed.
Percentage shows variance as percent over or under budget.
Dollars shows the dollar difference between budget and actual.
Both displays both figures side by side.