Bar/Column Charts
- 19 Aug 2025
- 1 Minute to read
- Print
- DarkLight
Bar/Column Charts
- Updated on 19 Aug 2025
- 1 Minute to read
- Print
- DarkLight
Article summary
Did you find this summary helpful?
Thank you for your feedback!
To create a bar chart, follow the instructions to open the Insights window in Creating Insights. Then, navigate to the top left corner of the screen and select the chart image: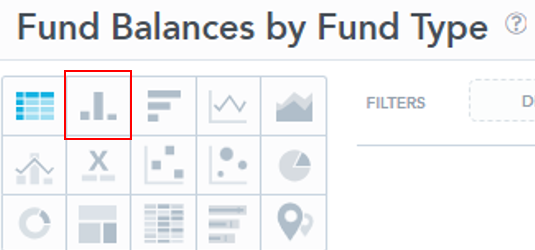
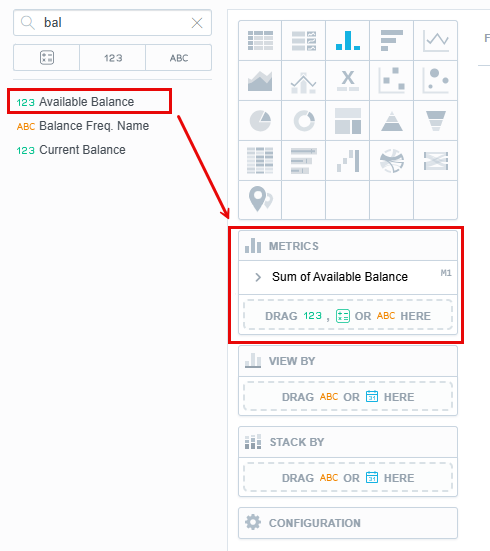
1. Choose a variable you would like to display:
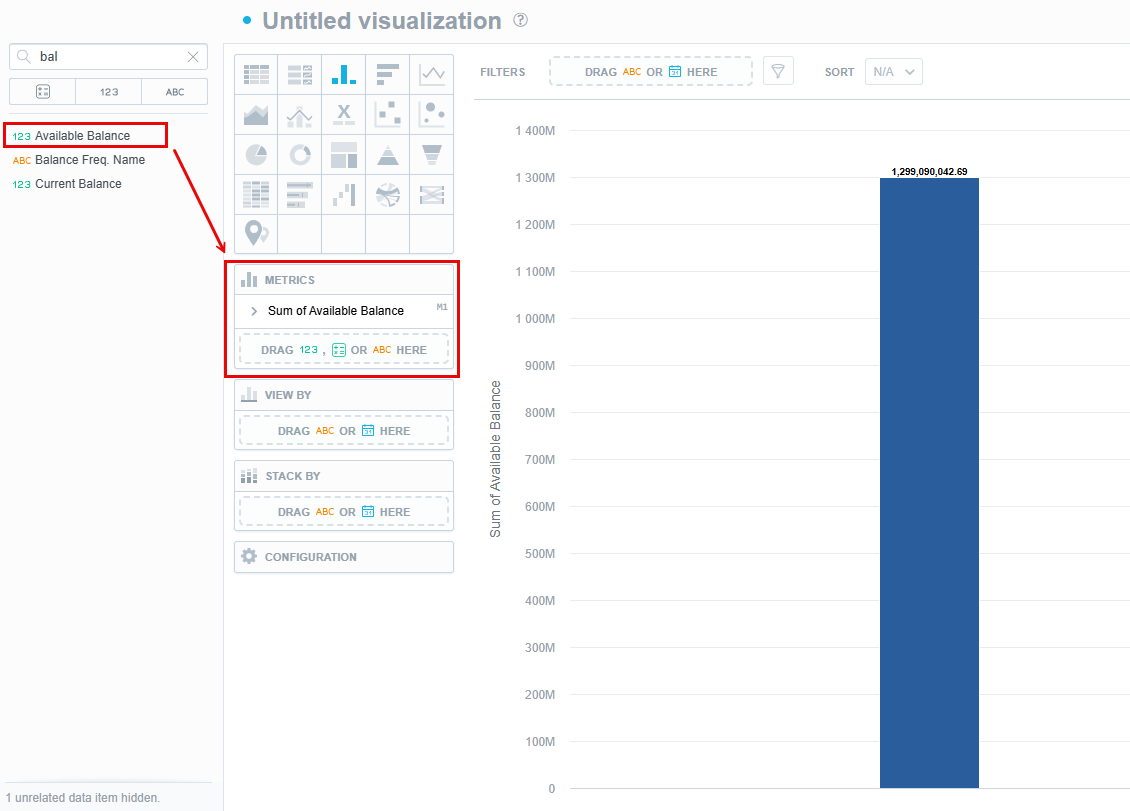
2. This will create the following chart:
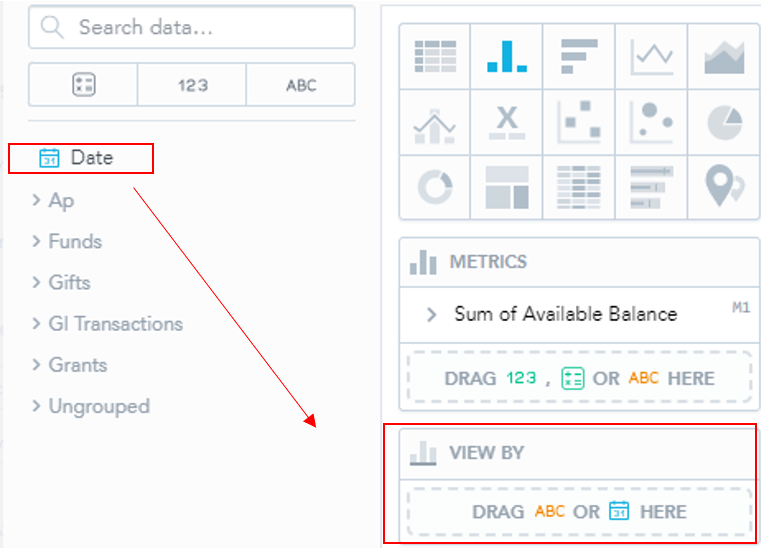
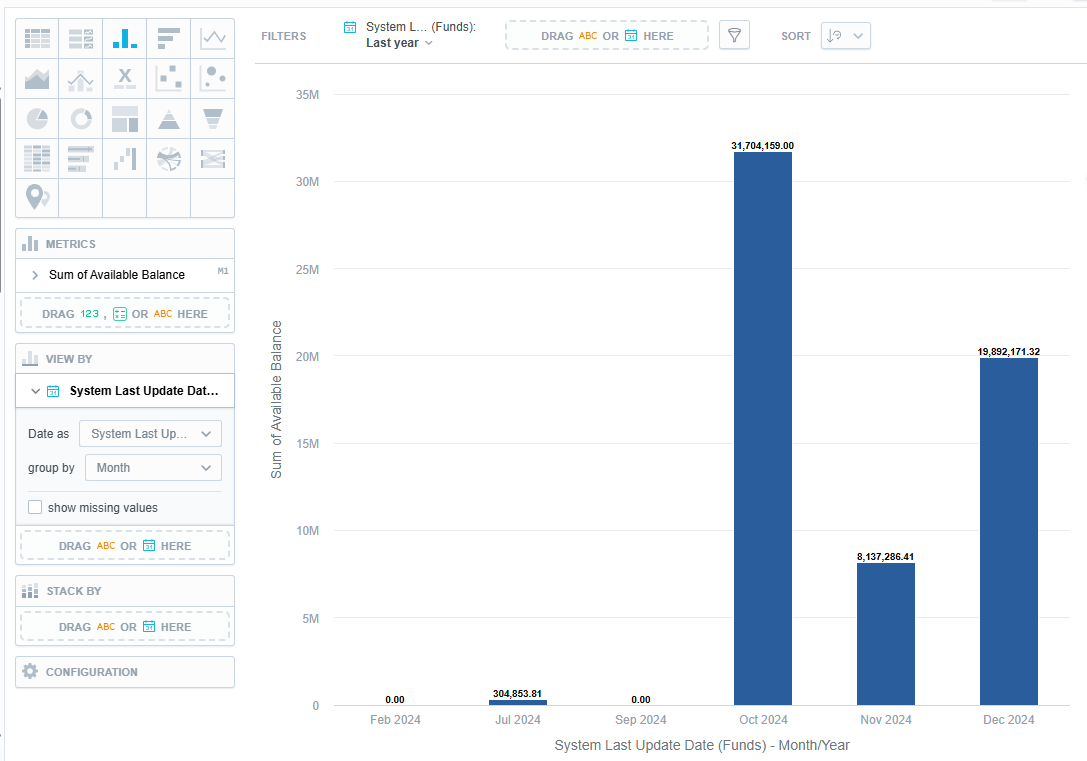
3. To modify this chart, select a secondary and tertiary variable from the drop-downs on the left.
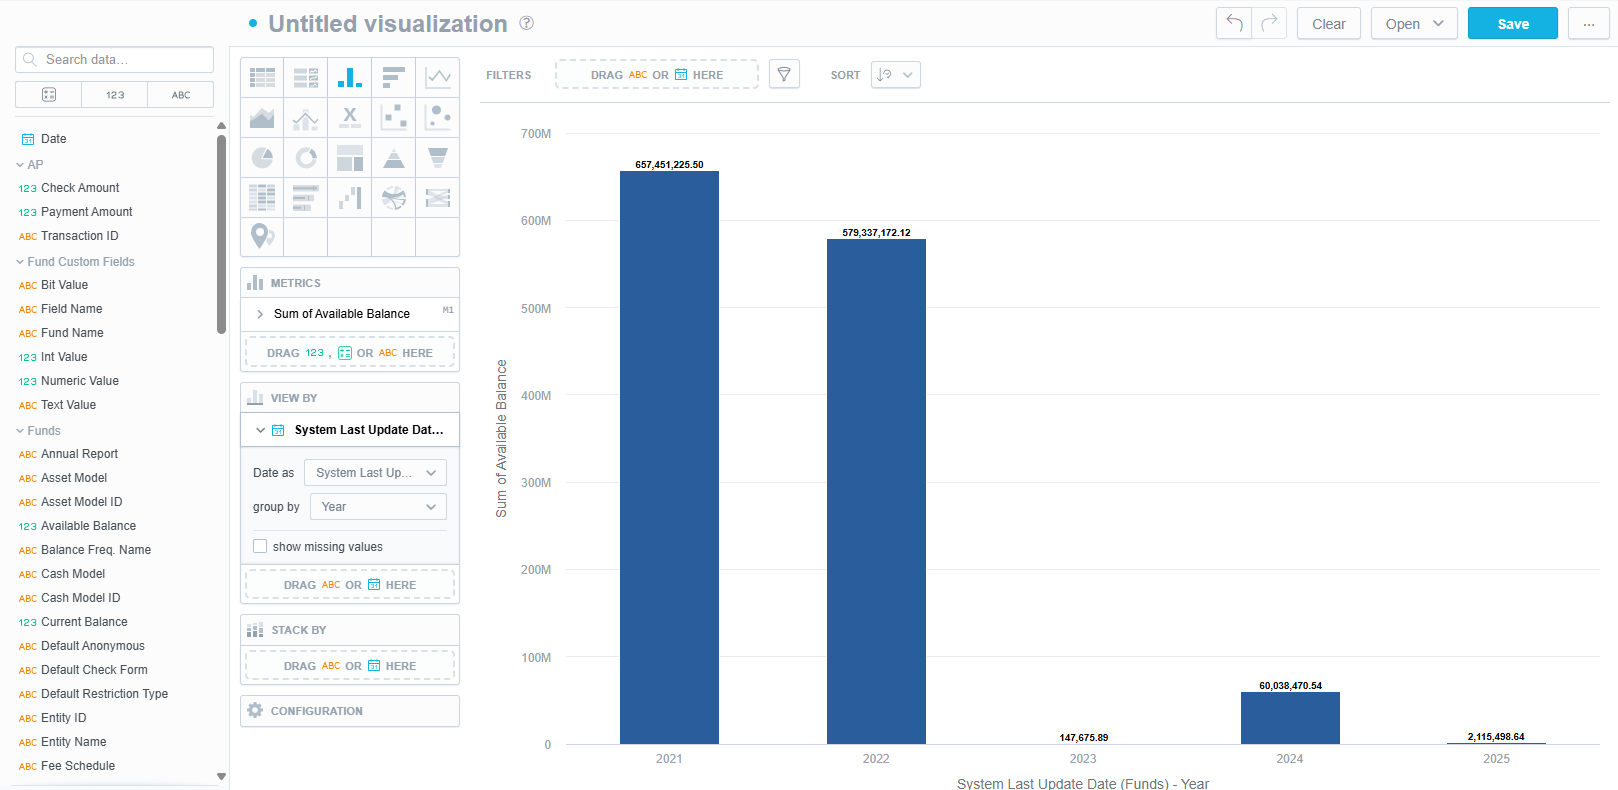
- To sort the data by a date, select the “Date” option from the left and drag it into the “View By” box.
- Once you have dropped the “Date” variable into the “View By” box, drop down menus should appear:
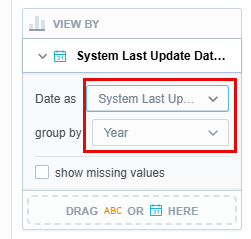
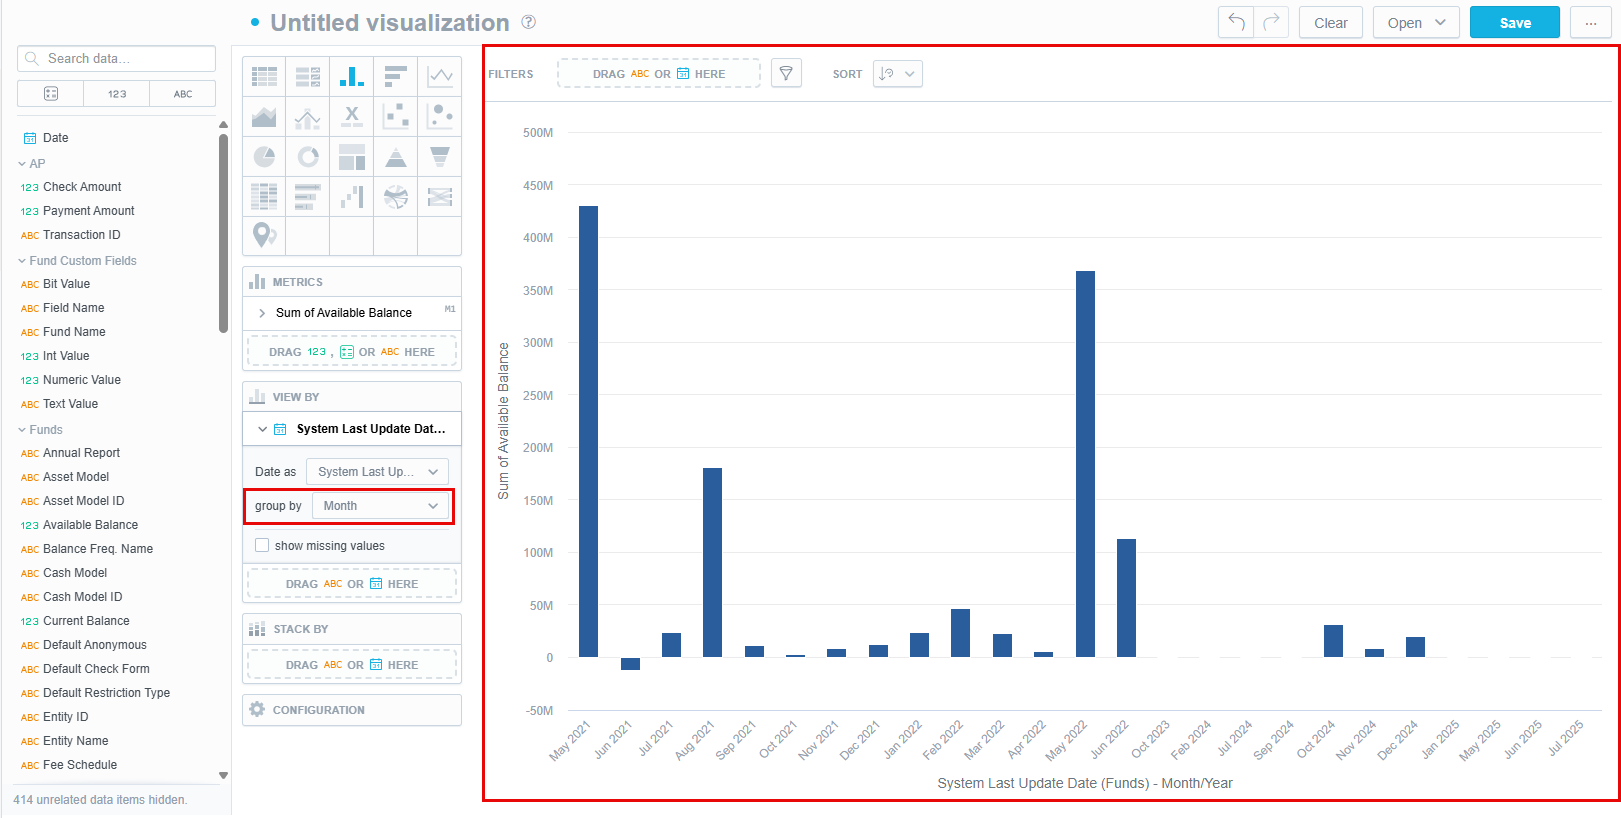
- You can change these to fit the purpose of your Visual. Here, we will select “Month” instead of “Year”:
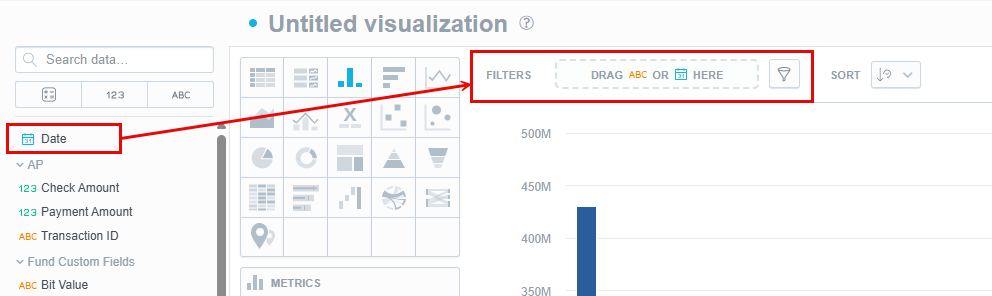
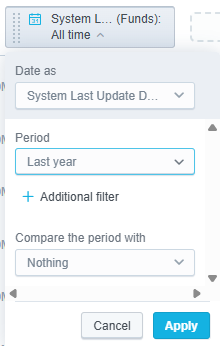
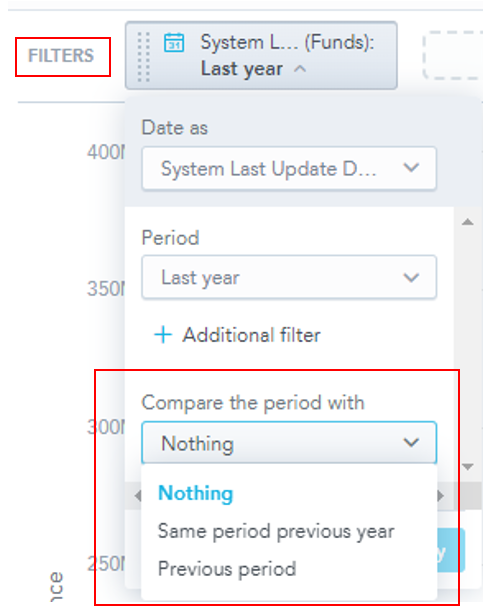
- You can also change the time frame of the data. To do so, navigate to the “Filters” option in the toolbar.
- Selecting the arrow next to “Last Year”, we can change the timeframe by selecting “Period”:
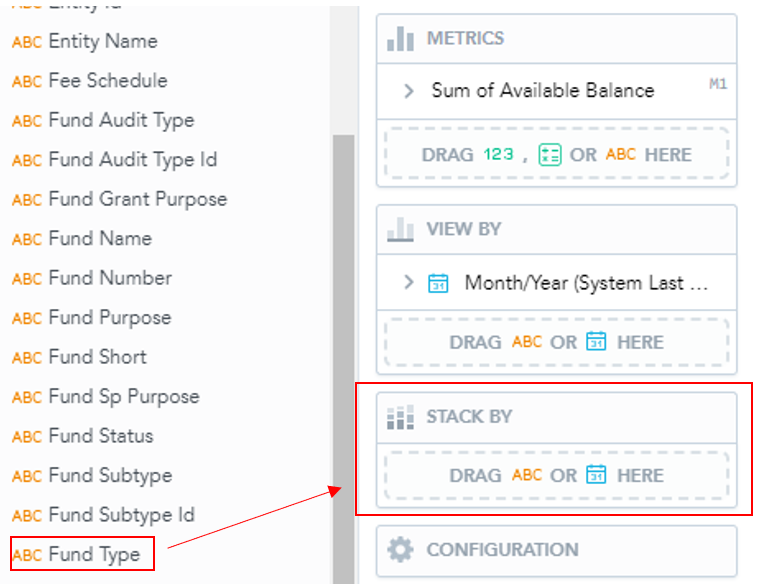
- If you want to use a tertiary variable, select a variable from the list on the left and drag it into the “Stack by” box:
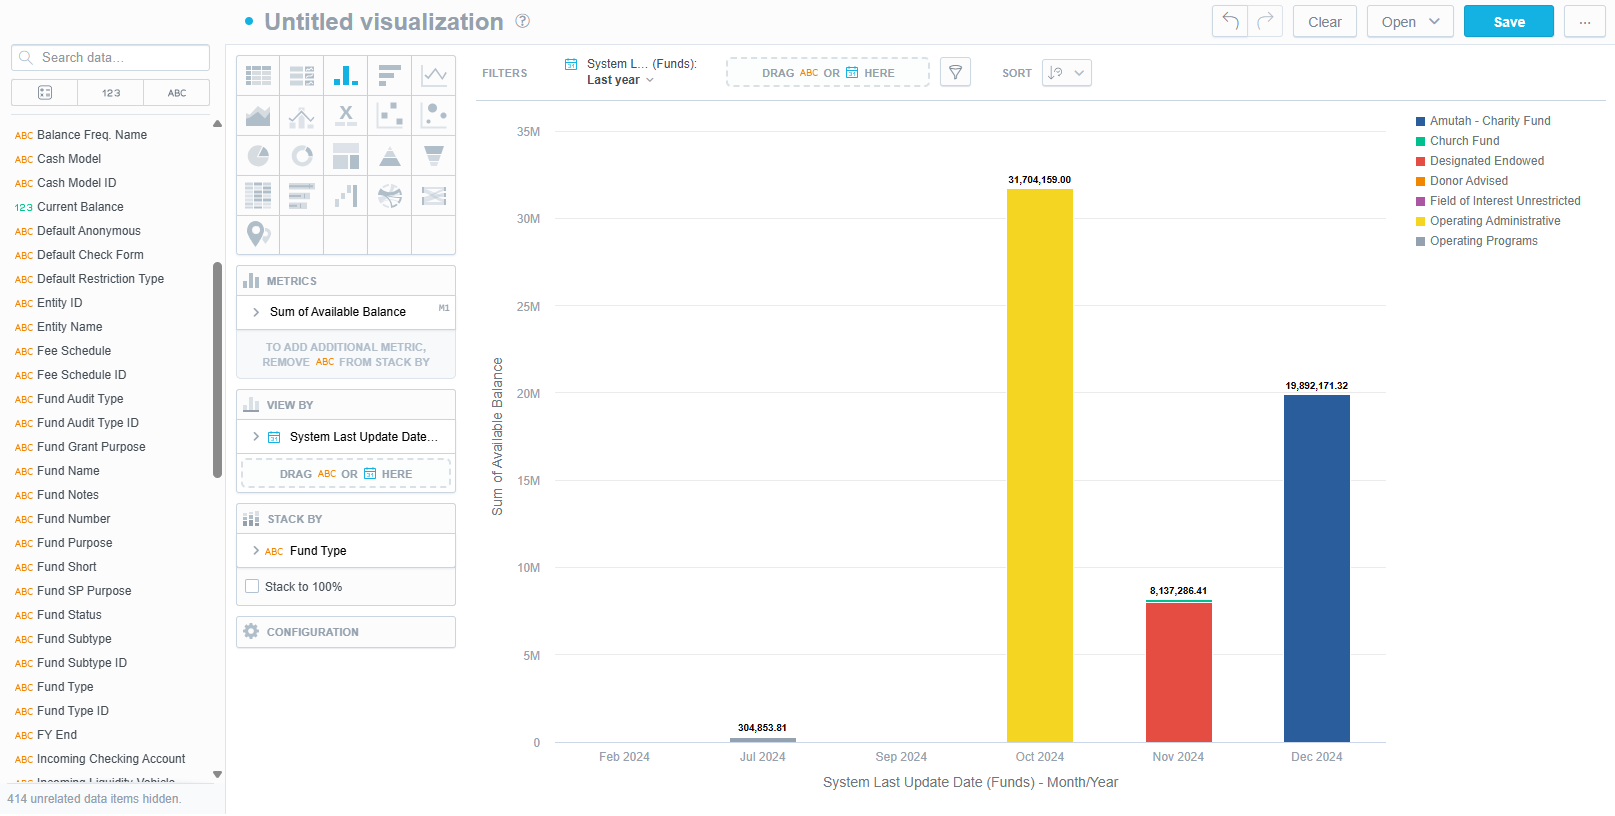
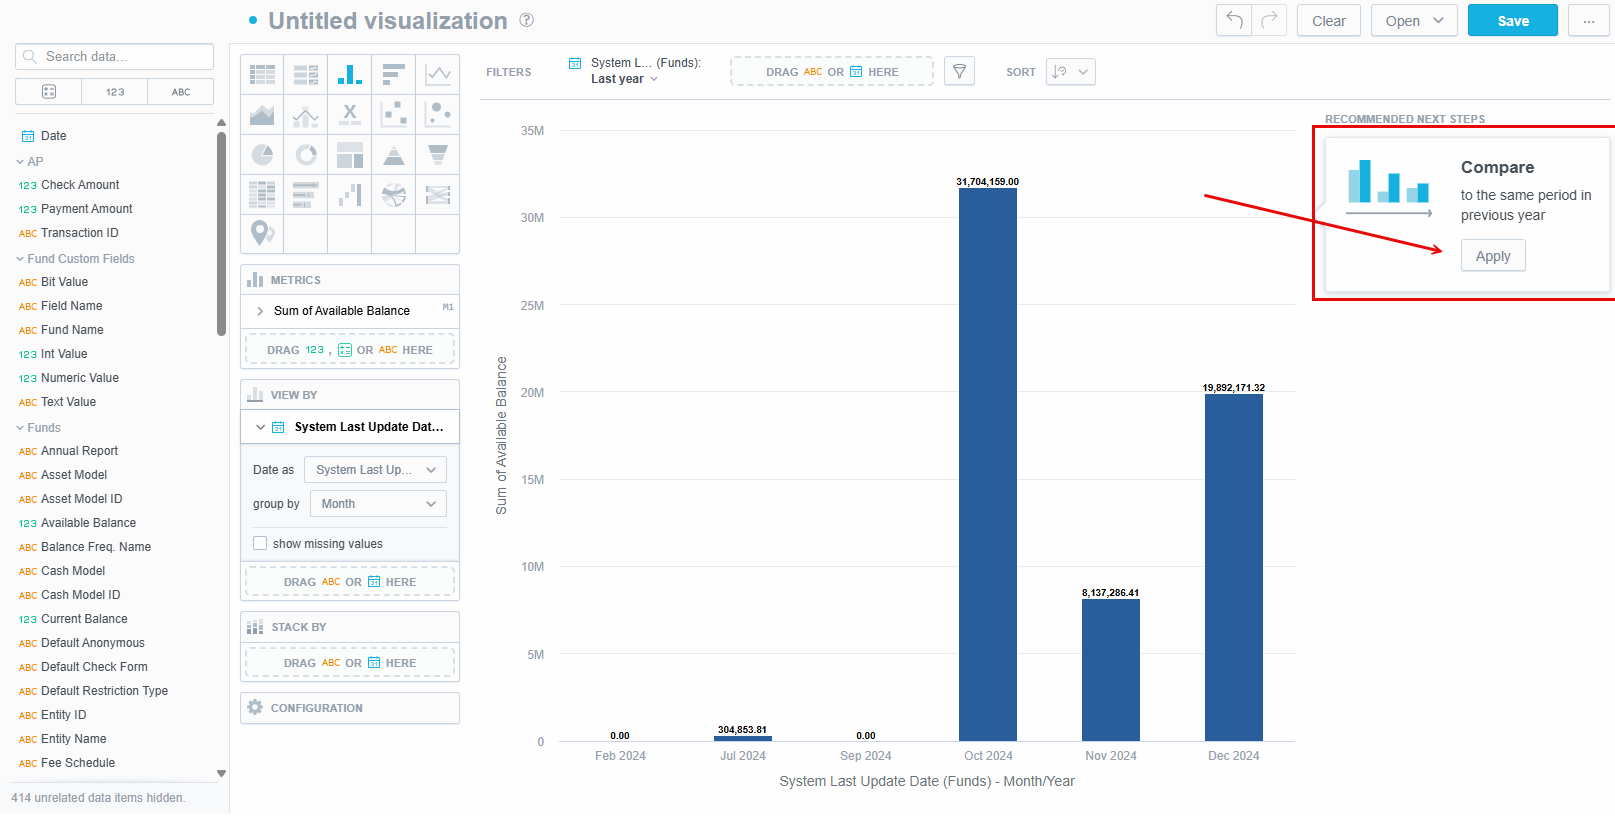
- This will then separate the Available Balances by their fund types and the date that the fund was last updated to create the following chart:
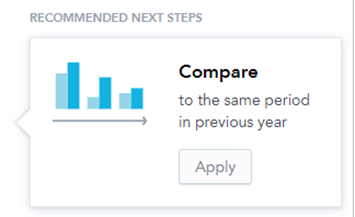
4. For some Visuals, Analytics may offer assistance. For the example above, it has suggested the following:
- Use the drop-down menu to alter the proposed changes:
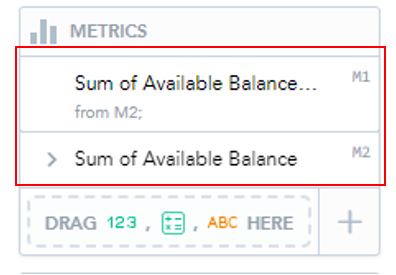
- You can either click apply, and Analytics will make the selected changes to your Visual, or you can return to the list of variables. If you click apply, a variable will populate in the “View By” box:
- Good Data may suggest more changes and may alter your variables if you accept:
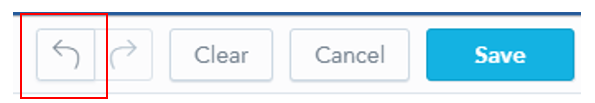
- If GoodData makes an unexpected change that you are unhappy with, simply click the undo button in the top right corner and it will return to the previous version:
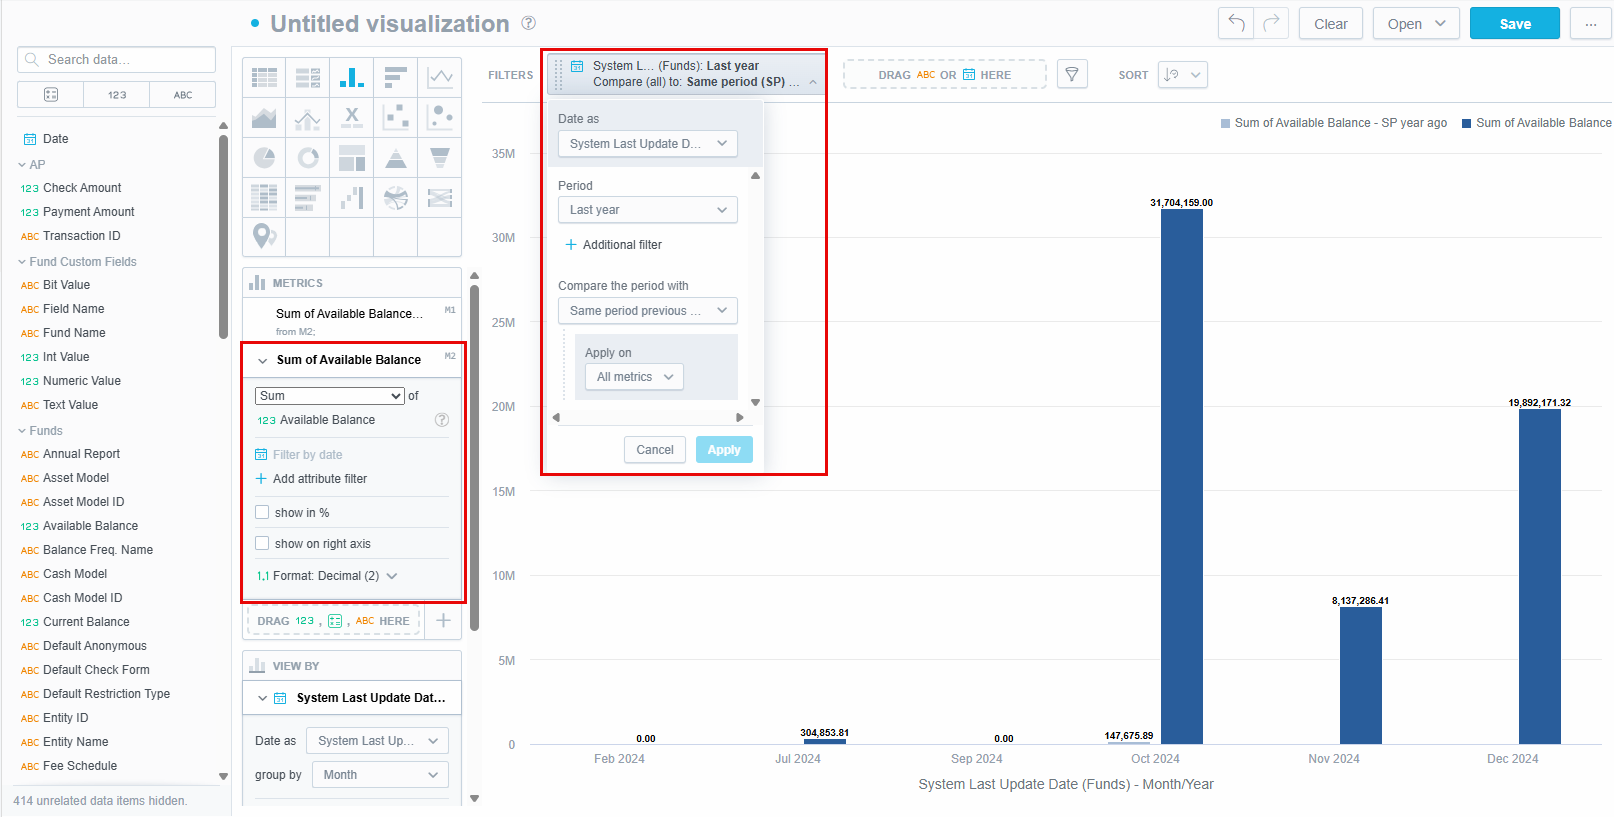
- You can manually instruct GoodData to compare data using the “Filters” option and selecting “Compare the period with”:
Was this article helpful?